With the weekends’ Grand Depart, the Tour de France kicked off in the flat lands of Denmark and now moves into the (still flat) cobbles and farmers tracks of Northern France. The high mountains seem a long way away, with the riders only reaching the Alps towards the end of the second week, but it’s where the race for yellow is traditionally won and lost.
While many would see the sheer volume of climbing in high mountains as the main filter between the wheat and the chaff, climbing to such elevations introduces the ever present challenge of hypoxia. This year, the Queen stage sees the riders take on the Galibier on Stage 11 and Stage 12, topping out at 2642 m. Anyone who has trained in our chamber knows just how hard it is to operate at this sort of altitude!
Many researchers have previously aimed to quantify the effect of such altitudes on performance. Most of these have focussed on the effects of altitude on the functional threshold power, or lactate threshold, which have were thought to be two important models of endurance performance. In more recent times, however, the critical power model has garnered ever increasing attention, and a new review has investigated the effects of altitude on performance within the context of critical power.
What Is Critical Power?
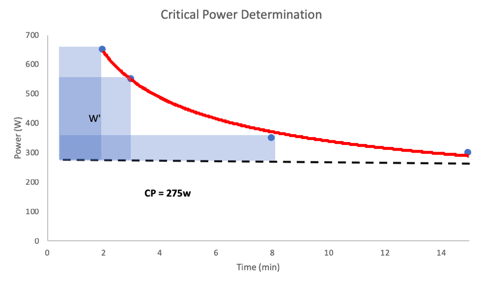
Critical power (or speed/velocity for runners) is considered the uppermost intensity at which a steady state can be achieved. It is hard, but sustainable; a heavy exercise intensity that you can maintain for some time. That is to say: heart rate is high, but not necessarily rising; lactate is high, but not rising and; the amount of oxygen you are using is high, but not rising. At such intensity, physiological markers are stable, and we are said to be in steady state. Above this intensity, these do start to rise further, so we are no longer in steady state, instead moving into the severe intensity domain, above which these markers rise uncontrollably and we reach fatigue in a matter of minutes. As such, critical power represents an intensity boundary between ‘sustainable’ steady state exercise, and ‘unsustainable’ severe intensity exercise.
Clearly, therefore, the critical power is an important performance metric, and it has been shown to correlate very strongly with cycling, running and rowing performance, with a higher critical power associated with greater performance levels.
You will notice that the model dictates that once you go over the critical power, exercise must stop within a matter of minutes. The time that can be spent above critical power is actually entirely predictable based on the amount of work done. Work = power x time, and every individual has a set amount of work they can do above CP. They could, for example, do 200 W above critical power for 5 seconds, or 20 W above critical power for 50 seconds. Both would amount to 1000 J of work done before fatigue sets in. That 1000 J is known as the Watts prime (W’). In the figure below, the W’ is represented by the 3 blue rectangles, and you’ll notice that even though each represents a different power output and time duration, they all have the same area, which demonstrates that mathematically, the W’ is constant.
Why does this matter? Well the critical power (CP) or speed (CS) is strongly correlated to performance. For example elite marathoners have been shown to race at or just below the critical speed, so the higher the CS the better the performance. What’s more, racing is, by it’s very nature, highly stochastic, characterised by short periods of very high intensity activity which ultimately determine the race (think of breakaways, attacks, and finishing sprints). The ability to hold both a very high CP and a high W’ is therefore key to endurance performance success.
What About CP and W’ at Altitude?
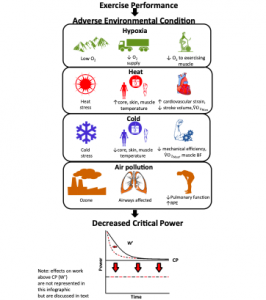
By definition, CP represents the maximum intensity at which a steady state can be achieved; a steady state relying on aerobic metabolism. As such, any reduction in available oxygen is likely to reduce this ‘upper ceiling of steady state work.’ Indeed, that is reflected in the literature, with studies observing between 14-25% reduction in CP dependent on the population studied and the level of hypoxia. The authors of the current review cite findings that hypoxia reduces not only blood oxygenation as a result of reduced oxygen intake and diffusion into the lung, but also because both the maximal cardiac output (the maximum amount of blood being pumped out by the heart) and the blood flow through the leg musculature, are reduced. Therefore not only is there less oxygen in the blood, but less blood being pumped out and sent to exercising muscle. So, when the athletes are duking it out on the upper slopes of the Galibier, it is likely that they will be significantly down on where they would be at sea level – probably even more so than the average rider given elite athletes’ susceptibility to high altitude.
Interestingly the effect of hypoxia on W’ is perhaps less clear. Some studies have observed no decrement to W’ at high altitude, which makes sense if W’ is considered a purely anaerobic energy source- that is, completely unreliant on oxygen. However, other studies muddy the water somewhat, and observe large reductions (45%) in W’. Of note is the fact that this study exposed athletes to severe altitude (4250 m). Because metabolism is never truly anaerobic, it is likely that the large reductions in resting muscle and blood oxygen concentrations at such severe altitudes do have some impact on W’ by reducing the immediately available supply of oxygen. It is also possible that at such altitudes, blood flow is preferentially directed to respiratory muscles to improve breathing mechanics. It’s important to note that this only seems to be the case at severe altitudes, far higher than those the Tour will ever visit, and as such the total work done above CP shouldn’t be affected, the riders will just have to remember that they will be dipping into their W’ at a much lower power output than they would at sea level!
Hypoxic Training To Combat The Effect of Hypoxia on CP
It remains to be studied how hypoxic training might protect against the effects of altitude on CP. However, we have seen time and again that different styles of altitude training (live low train high, or live high train low, terrestrial or simulated) have the effect of raising the blood oxygenation for a given exercise intensity. Given this is one of the fundamental causes of reduced CP at altitude, both due to reduced oxygen delivery and the fact that low blood oxygenation is a trigger for reduced cardiac output, it seems likely that increasing blood oxygenation at altitude would mitigate the detriment to CP. We have seen that 6 weeks of twice weekly hypoxic training can raise blood oxygen saturation during exercise by betweeen 6-10 percentage points, an important difference when every second matters come race day.
So when it comes to the mountain stages and you’re looking for a tip for the day, you might do well to consider the guy who’s spent the most time at altitude before the race!
Reference: